Savvy by Cohesion
Building a Data Product for Real Estate Decision-Making
Executive Summary
https://www.cohesionib.com/products/savvy
Savvy is Cohesion’s analytics and AI platform designed to turn fragmented building data into clear, actionable insights for real estate leaders.
I led the development of Savvy as a data product, defining its strategy, data architecture, analytics layer, and AI capabilities. This included building the semantic data model, designing analytics workflows, shaping the AI assistant, and driving go-to-market execution.
The result was a platform that:
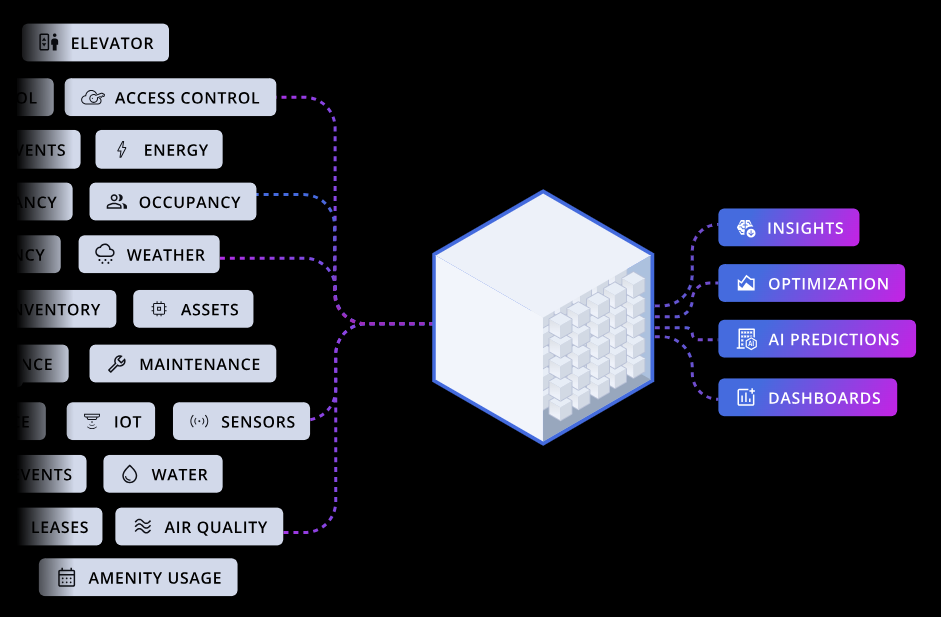
Centralizes data across building systems, sensors, and business tools
Enables both self-service analytics and AI-driven insights
Helps customers make decisions around cost, occupancy, space, and operations
Establishes a foundation for digital twin, predictive analytics, and automatio
Savvy ultimately repositioned data from a reporting function into a core product capability within Cohesion’s platform.
What Savvy Is
Savvy is a unified analytics product that combines dashboards, AI, and automated insights into a single interface.
At a product level, it consists of three core components:
1. Customizable BI Dashboards
Interactive dashboards embedded directly into the Cohesion platform.
Portfolio, building, and tenant-level views
Metrics across occupancy, space utilization, energy, and operations
Configurable per customer, with dashboards enabled based on use case
2. AI Assistant
A conversational interface that allows users to query their building data in plain language.
Backed by a custom AI agent
Translates natural language into structured queries against the datamart
Returns contextualized answers combining multiple data sources
3. Automated Insight Summaries
Pre-generated insights that surface key patterns and anomalies without requiring user input.
AI-generated summaries embedded directly into the platform
Highlight trends like underutilization, cost inefficiencies, or unusual activity
Designed to proactively guide users toward decisions
Why this matters
This structure allowed Savvy to serve both:
Analysts → deep, self-service exploration via dashboards
Non-technical users → fast answers and guidance via AI and insights
Instead of forcing users to “go find answers,” the product meets them at multiple levels of sophistication.
The Problem
Real estate teams had access to large amounts of data, but it was:
Distributed across systems (access control, sensors, energy, leasing, etc.)
Inconsistent and poorly structured
Dependent on manual analysis
Largely inaccessible to decision-makers
As a result, critical questions were difficult to answer:
Where are we wasting money?
Which spaces are underutilized?
What is driving operational inefficiency?
Etc.
Savvy’s core premise was simple: Bring all building and business data into one place, and make it usable for real decisions.
My Role
I operated as the Product Manager for “data as a product”.
That meant working across:
Product, engineering, data, and design
Executive leadership (CEO, CTO, VPs)
Sales, marketing, and implementation
Commercial and enterprise customers, including tenant, engineering and building managers
Key responsibilities:
Defined data product strategy and roadmap
Designed semantic data layer + datamart
Led analytics and dashboard design
Contributed to AI assistant (prompt + query logic)
Contributed to data engineering and ingestion of external sources
Drove GTM, demos, and customer adoption
Approach: Start With Decisions
Most analytics products start with data and build dashboards. My approach started with the user benefit:
Start with the decision (or automation) → work backward to the data
Example: Space Optimization
Decision: Should we reduce space?
Data Needed: Occupancy (badge swipes or occupancy sensors) + reservations + cost
Insight:
Department attendance
Cost per occupant
Underused space
Comparisons across office portfolio
Example: Cost Optimization
Decision: Where are we overspending?
Data Needed: Energy and utility usage and spend + operational line items + occupancy
Insight:
Energy use per occupant (across portfolio)
Operational cost per occupant (rent, office investment, etc.)
Inefficiencies across portfolio normalized by occupancy
Building the Data Foundation
The most fundamental part of building Savvy was developing a reliable data layer.
We built a full analytics stack centered on Databricks as the warehouse, with structured pipelines, a governed data model, and a Power BI semantic layer on top.
Sources → Raw Tables → Datamart → Power BI → Dashboards + AI + Automation

Ingestion & Transformation
Databricks served as the central data platform.
We ingested data from:
APIs (access control, utilities, sensors)
IoT streams (occupancy, IAQ)
Internal systems + CSV uploads
We structured this using a medallion architecture:
Bronze: raw data
Silver: cleaned and standardized
Gold: analytics-ready datasets
This ensured data was consistent, traceable, and reusable across use cases.
Datamart: Structured for Analytics
On top of this, we built a Databricks datamart with two layers:
Canonical Tables
Raw + normalized fact, dimension, transaction tables
Examples: badge swipes, reservations, service requests
Joined via keys like Building_Code, Company_Code, Local_Date
This formed a snowflake-style model with shared dimensions across all datasets.
Aggregated Tables
Pre-calculated datasets (occupancy, utilization, visitors, etc.)
Designed specifically for analytics performance
This pushed heavy computation upstream and made dashboards fast.
Power BI: Semantic Layer & Measures
Power BI sat on top of Databricks and handled:
Table relationships (building, company, date)
Business logic via measures
Final aggregation and filtering
Key principle:
Databricks = heavy computation
Power BI = flexible analysis
For example, metrics like utilization were calculated as measures (e.g. total occupancy ÷ total capacity), so they scaled correctly across filters
Data pipelines ran daily overnight, with selective near real-time updates for specific use cases
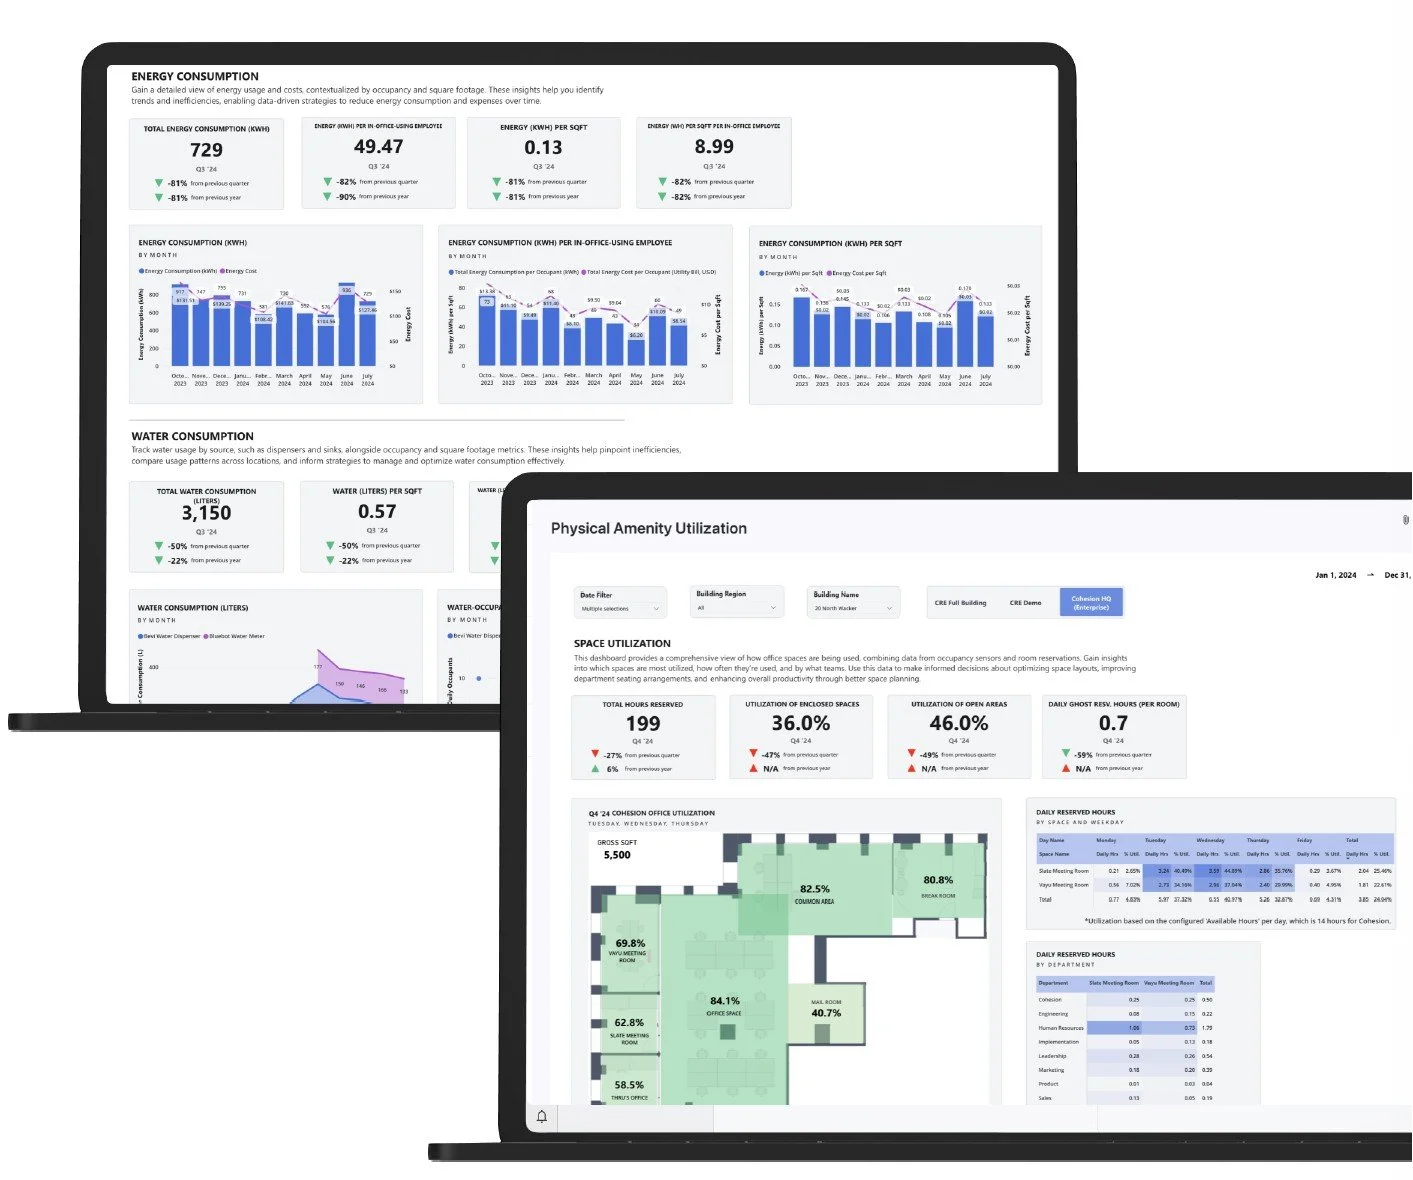
Visualization: Turning Data Into Insight
The most straightforward view of the data was as a set of BI dashboards, divided by use case and data context. On one screen, users could see KPIs and in-depth analyses of how a building’s tenants are utilizing their spaces; on another screen, they could compare energy use across their portfolio as it relates to actual building square footage and occupancy. And so on, and so on.
We developed a modular system in the frontend to allow us to control what customers and users have visibility into what analyses and data sources. Accounting for things like security level, seniority, and data availability.
The system was designed to balance:
Standardization (shared datasets and analyses across customers)
Flexibility (custom analysis per client)
Dashboards were modular and enabled per customer, but all built on the same core data model.
AI Layer: Making Data Accessible
Savvy’s AI assistant made the platform usable for non-technical users.
Instead of dashboards alone, users could ask:
“Which buildings are underutilized?”
“How can I reduce energy costs?”
“What’s driving high operating costs?”
Responses provide not only a set of data to directly answer the user’s question, but also significant context and interpretation of that data - powered by the prompt engineering and agentic systems working in the background. This would allow users to quickly understand and interpret their data, and take action accordingly.
Behind the scenes:
Structured prompt engineering
Example query training (200+ cases)
Context-aware SQL generation
Validation + retry logic
We have also implemented automated insight summaries generated throughout the platform (such as inside our Smart Maintenance features) which summarize key data insights about the relevant on-screen context. This allows users to not have to search for insights, but be presented with them in the context they are already working.
For example: A user is updating a work order and is able to see that this work order is related to the same maintenance issue that has already occurred 30 times in the past month. An outlier. The summary delivers this insight and suggests actions of how to proceed.
Go-To-Market & Adoption
A strong product alone wasn’t enough, we had to make it understandable. Given that Savvy is a fairly technical and analytical product, I had to work with customers and customer-facing teams to understand the full use and benefit of Savvy.
I led and supported:
Product demos to customers
Early-access rollout + feedback loops
Sales training and enablement
Documentation, FAQs, and guides
Data storytelling for marketing
This ensured:
Sales could clearly explain value
Customers could quickly adopt the product
Leadership could position Savvy strategically
Impact
Product Impact
Established data as a core product pillar at Cohesion
Enabled cross-system analytics across buildings and portfolios
Created foundation for AI + digital twin strategy
Customer Impact
Reduced reliance on manual analysis
Enabled faster, better decision-making
Delivered insights across:
Cost
Occupancy
Space utilization
Operations
Energy
Technical Impact
Standardized data modeling + governance
Improved pipeline reliability and performance
Created scalable architecture for future analytics
Closing
This work sits at the intersection of:
Product strategy
Data architecture
Analytics
AI
My role was to connect all of those into a single, usable product.
And more importantly: Turn complex, messy building data into something people can actually use to make decisions.