Product Process Revamp and Priority Calculator
Executive Summary
When I joined Cohesion, product development was reactive, unstructured, and increasingly unsustainable as the company scaled.
I led a full overhaul of the product process: introducing Agile structure, defining a delivery cadence, and building a data-driven prioritization system that ranked every ticket objectively.
The result:
Sprint velocity increased ~40%
On-time delivery improved from ~60% → ~95%
Engineering, product, and leadership aligned around a single, transparent plan
Problem Statement
The main issue wasn’t lack of effort (my engineering team members are some of the smartest, most efficient workers I’ve ever met) - it was lack of structure. Everyone was busy, but the team didn’t have shared visibility into what we were busy with or why.
At the time we were operating in a loosely defined Kanban model:
No sprints, no backlog refinement
Priorities shifting daily
Work driven by whoever was making the most noise
Ad hoc tickets immediately prioritized out of nowhere
The process was completely failing and the symptoms were obvious:
Tickets entered development with incomplete requirements.
Bugs and features lived side by side with no consistent prioritization.
No concept of a “sprint”. Work started and finished whenever someone had time.
Engineers often didn’t know what was coming next until the morning of.
There was no predictable way to communicate timelines to customers.
We needed a process that allowed us to plan work, track it, and make tradeoffs intelligently.
My Role
I was the sole Product Manager across:
Access, Experience, Maintenance, and Savvy
~15 engineers + 1 designer
Dozens of active customer implementations
My goal was simple: Build a system that makes it clear what we’re working on, why, and what comes next.
Process Overhaul
The first step was to create a repeatable product delivery cycle - something lightweight enough to not slow anyone down, but structured enough to align engineering, product, and leadership around a single plan.
1. Creating Ceremonies and Cadence
I incrementally introduced a set of core Agile ceremonies to give our work rhythm and predictability:
Weekly Refinement: All new scope for features and stories reviewed, estimated, and clarified before entering a sprint.
Sprint Planning: Bi-weekly meetings where we finalized the upcoming sprint’s commitments, balancing roadmap features with bugs and tech debt.
Retrospectives: A short, honest look at what worked, what didn’t, and what to adjust.
Quarterly Sprint Plan: A high-level forecast mapping out major features and delivery targets for the quarter.
It took some time to work out exactly how each ceremony would work, but within a few cycles, we had made a tremendous amount of progress in terms of productivity, efficiency, and overall sentiment of the engineering team and stakeholders. New scope was complete ahead of the sprint, and the entire team understood the “why” behind what we were building.
2. The Prioritization Problem
Even with structure in place, we faced a much harder challenge: How do we decide what to build next? Or, how can we keep up with the overwhelming number of tickets, and ensure we know that what we’re working on is the highest priority?
Because truly our workload was harrowing - an enormous number of tickets and simultaneous priorities, with everyone working on many items at once.
We had dozens of customer implementations in progress, a huge backlog of bugs and enhancements, and major roadmap items all competing for the same limited engineering bandwidth. Simply labeling everything “High Priority” wasn’t working.
We needed a system or tool that treated every ticket the same way, removed subjectivity, and ranked work by urgency, impact, work remaining, customer deadlines, and strategic importance.
So I built one.
The Priority Calculator
At its core, the calculator is a scoring model that ranks every open ticket in Azure DevOps based on a blend of time sensitivity, customer importance, bug severity, and scope complexity. It produces a single, ordered list of what should be worked on next.
The logic can be summarized as follows:
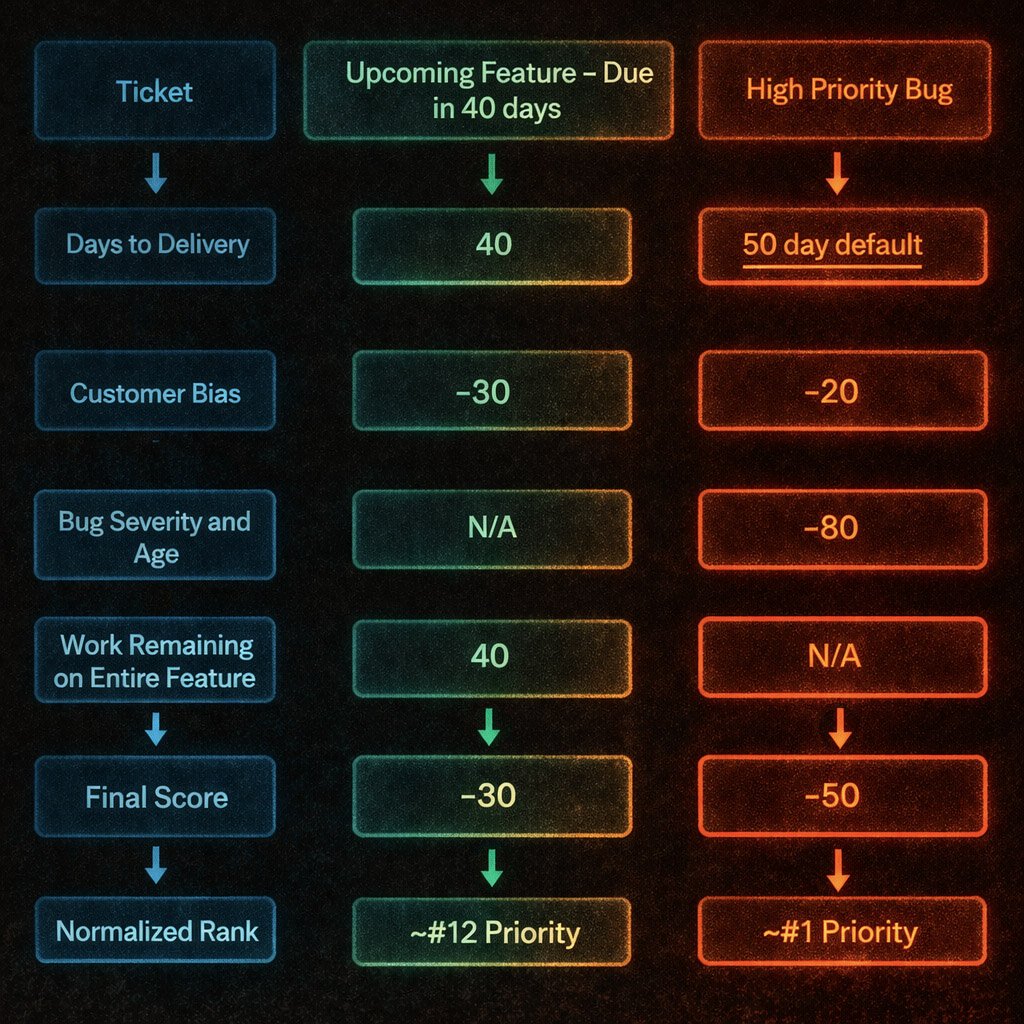
Delivery Timing: Tickets with known customer delivery or roadmap dates are weighted based on the number of days until delivery (a lookup exists to pull the delivery dates on the ticket itself and the ticket’s associated parent). If no date exists, a default of 50 days is assumed. Fewer days = higher priority.
Customer Importance: If a ticket is tied to a strategic customer, a weighted bias is added based on a lookup table.
Bug Severity: Instead of relying on the “Priority” field in DevOps, it is recalculated from our own severity-impact matrix. Severity = How bad is it?; Impact = How many customers are effected? Critical bugs (outages) get a large negative weight (-999), medium bugs -80 or -10, and so on. Bugs also gain priority over time as they age.
Initiative Scope: If the ticket isn’t yet assigned to a specific sprint (only to a quarter or initiative), it receives a small penalty (+10) to lower its priority until it’s ready.
Parent Work Remaining: Tickets within features that have significant remaining work get boosted slightly to help complete features faster.
Closed/Resolved States: Closed or resolved tickets are pushed to the bottom automatically (score of 99,999).
After the score is calculated, each ticket is ranked relative to the rest.
This creates a dynamic, automatically ordered backlog where the top item is always the highest priority based on objective data.
The calculator then also generates the projected sprint number given the priority calculation (e.g., this ticket should be scheduled for Sprint 112, vs the currently scheduled 109).
As a measure before / during backlog refinement, I go through the calculator and make adjustments as needed to the upcoming sprints (and adjust the calculator as needed).
Integration and Rollout
Built in Excel, connected to Azure DevOps via Office connector
Refreshed multiple times per week
Used directly in backlog refinement and sprint planning
Over time:
Became the source of truth for prioritization
Trusted by engineers (transparent logic)
Trusted by leadership (aligned to deadlines and customers)
We have been exploring an API-based version of this system for direct integration and daily refreshes (and creating a quick UI via vibe-coding), but the Excel prototype alone transformed how we operated.
Takeaways
Process Impact
Clear, repeatable delivery cycle
Improved cross-team alignment
Predictable sprint planning
Engineering Impact
Reduced ambiguity in what to work on
Increased focus on highest-value work
Faster completion of in-progress features
Business Impact
Deadlines tied directly to execution
Better communication with customers
More confidence in delivery timelines